Market Outlook
September 14, 2017
Market Cues
Domestic Indices
Chg (%)
(Pts)
(Close)
Indian markets are likely to open flat tracking global indices and SGX Nifty.
BSE Sensex
0.1
28
32,186
After moving higher over the two previous sessions, stocks showed a lack of
Nifty
(0.1)
(14)
10,079
direction throughout the trading session and the US markets ended the day with a
marginal gain. The major averages spent the day bouncing back and forth across
Mid Cap
(0.7)
(110)
15,927
unchanged line. The choppy trading on Wall Street came as traders expressed some
Small Cap
(0.6)
(98)
16,520
uncertainty about the near term outlook for the markets following the recent
strength.
Bankex
0.2
47
27,950
The European markets ended Wednesday’s session with mixed results but were little
Global Indices
Chg (%)
(Pts)
(Close)
unchanged overall. Traders were cautious ahead of Thursday’s policy decision from
the Bank Of England. Investors are also keeping an eye on the progress on US
Dow Jones
0.2
139
22,158
President Donald Trumps tax reform bill.
Nasdaq
0.1
06
6,464
Indian markets ended on a choppy note on Wednesday after the news of higher
FTSE
(0.3)
(21)
7,380
retail inflation and lower IIP data. Industrial production grew by a subdued 1.2% as
Nikkei
(00.5
89
19,866
against 4.5% growth in July. However, the overall sentiment in the domestic markets
continue to remain positive.
Hang Seng
(0.3)
(78)
27,894
Shanghai Com
0.1
5
3,384
News Analysis
BPCL to invest `1.08 trillion in 5 years, to focus on petrochemicals segment
Advances / Declines
BSE
NSE
Detailed analysis is on Pg2
Advances
1,988
1,603
Declines
1,638
1,081
Investor’s Ready Reckoner
Unchanged
159
76
Key Domestic & Global Indicators
Stock Watch: Latest investment recommendations on 150+ stocks
Volumes (` Cr)
Refer Pg7 onwards
BSE
3,572
Top Picks
NSE
29,176
CMP
Target
Upside
Company
Sector
Rating
(`)
(`)
(%)
Blue Star
Capital Goods
Accumulate
795
807
1.5
#Net Inflows (` Cr)
Net
Mtd
Ytd
Dewan Housing FinanceFinancials
Accumulate
552
610
10.5
FII
(1,233)
(2(5,184)
4142,10
Mahindra Lifespace
Real Estate
Buy
450
522
16.1
MFs
8365
4,2,255
1471,14
Navkar Corporation
Others
Buy
192
265
38.1
KEI Industries
Capital Goods
Buy
299
371
24.2
More Top Picks on Pg5
Top Gainers
Price (`)
Chg (%)
Rtnpower
196
5.8
Key Upcoming Events
Previous
Consensus
Rdel
60
5.5
Date
Region
Event Description
Reading
Expectations
Bomdyeing
159
5.0
Sep 14, 2017 China
Industrial Production (YoY)
6.40
6.60
Religare
47
4.9
Sep 14, 2017 US
Initial Jobless claims
298.00
300.00
Sep 14, 2017 India
Monthly Wholesale Prices YoY%
1.88
3.20
Tatapower
85
4.8
Sep 14, 2017 India
Imports YoY%
15.40
Sep 14, 2017 US
Consumer price index (mom)
0.10
0.30
Top Losers
Price (`)
Chg (%)
More Events on Pg7
Jublfood
1,322
(7.3)
Bpcl
500
(6.2)
Hindpetro
457
(5.1)
Welcorp
135
(4.4)
Ioc
416
(4.3)
#as on 13th Sep, 2017
Market Outlook
September 14, 2017
News Analysis
BPCL to invest `1.08 trillion over the next five years to expand
operations
PSU giant BPCL intends to invest Rs 1.08 trillion over the next five years to expand
operations across its business segments. The company is bullish on the
petrochemical segments and plans to invest around Rs 45,000 cr in the business
over next five years. According to the management only 1% of the company’s
throughput is getting converted into petrochemicals and by 2022-23 it expects a
throughput of 10-15%, and this is likely to result in higher profitability. The
company’s current refining capacity is at 9 million metric ton p.a and it has
commissioned an integrated refinery project at Kochi, with which its refining
capacity will go upto 15.5 million ton.
Economic and Political News
Govt approves BSNL’s plan to spin off mobile tower business
Arun Jaitley says dormant accounts have fallen below 20% under Jan Dhan
Shinzo Abe’s visit puts spotlight on bullet train, renewable energy
Corporate News
Ericsson files insolvency petition against RCom to recover dues
Lupin gets USFDA nod to market generic antibacterial drug
SBI sets up team to track loan default resolutions
Hindalco to export Alumina from its Odisha unit
Market Outlook
September 14, 2017
Top Picks
Market Cap
CMP
Target
Upside
Company
Rationale
(` Cr)
(`)
(`)
(%)
Strong growth in domestic business due to its leadership
in acute therapeutic segment. Alkem expects to launch
Alkem Laboratories
21,526
1,800
2,161
20.0
more products in USA, which bodes for its international
business.
We expect the company would report strong profitability
Asian Granito
1,358
451
493
9.3
owing to better product mix, higher B2C sales and
amalgamation synergy.
Favorable outlook for the AC industry to augur well for
Cooling products business which is out pacing the
Blue Star
7,616
795
807
1.5
market growth. EMPPAC division's profitability to improve
once operating environment turns around.
With a focus on the low and medium income (LMI)
consumer segment, the company has increased its
Dewan Housing Finance
17,311
552
610
10.5
presence in tier-II & III cities where the growth
opportunity is immense.
Loan growth is likely to pick up after a sluggish FY17.
Karur Vysya Bank
9,089
150
180
19.7
Lower credit cost will help in strong bottom-line growth.
Increasing share of CASA will help in NIM improvement.
High order book execution in EPC segment, rising B2C
KEI Industries
2,325
299
371
24.2
sales and higher exports to boost the revenues and
profitability
Speedier execution and speedier sales, strong revenue
Mahindra Lifespace
2,308
450
522
16.1
visibility in short-to-long run, attractive valuations
Expected to benefit from the lower capex requirement
Music Broadcast
2,283
400
434
8.5
and 15 year long radio broadcast licensing.
Massive capacity expansion along with rail advantage at
Navkar Corporation
2,736
192
265
38.1
ICD as well CFS augurs well for the company
Strong brands and distribution network would boost
Siyaram Silk Mills
2,133
2,275
2,500
9.9
growth going ahead. Stock currently trades at an
inexpensive valuation.
Market leadership in Hindi news genre and no.
2
viewership ranking in English news genre, exit from the
TV Today Network
1,575
264
344
30.3
radio business, and anticipated growth in ad spends by
corporates to benefit the stock.
After GST, the company is expected to see higher
volumes along with improving product mix. The Gujarat
Maruti Suzuki
2,45,321
8,121
8,658
6.6
plant will also enable higher operating leverage which
will be margin accretive.
We expect loan book to grow at 24.3% over next two
GIC Housing
2,839
527
655
24.3
year; change in borrowing mix will help in NIM
improvement.
Source: Company, Angel Research
Market Outlook
September 14, 2017
Key Upcoming Events
Global economic events release calendar
Bl oomberg Data
D ate
Time
C ountry
Event Description
Unit
Period
L ast Reporte d
E stimate d
Sep 14, 2017
7:30 AM China
Industrial Production (YoY)
% Change
Aug
6.40
6.60
6:00 PM US
Initial Jobless claims
Thousands
Sep 9
298.00
300.00
12: 00 PM India
Monthly Wholesale Prices YoY%
% Change
Aug
1.88
3.20
India
Imports YoY%
% Change
Aug
15.40
6:00 PM US
Consumer price index (mom)
% Change
Aug
0.10
0.30
Sep 15, 2017
4:30 PM UK
BOE Announce s rate s
% Ratio
Sep 14
0.25
0.25
India
Exports YoY%
% Change
Aug
3.94
6:45 PM US
Industrial Production
%
Aug
0.19
0.10
Sep 18, 2017
2:30 PM Euro Zone
Euro-Zone CPI (YoY)
%
Aug F
1.50
Sep 19, 2017
6:00 PM US
Housi ng Starts
Thousands
Aug
1,155.00
1,180.00
6:00 PM US
Building permits
Thousands
Aug
1,230.00
1,210.00
Sep 20, 2017
7:30 PM US
Existing home sales
Million
Aug
5.44
5.48
11: 30 PM US
FOMC rate decision
%
Sep 20
1.25
1.25
Sep 21, 2017
7:30 PM Euro Zone
Euro-Zone Consumer Confidence
Value
Sep A
(1.50)
Sep 22, 2017
1:00 PM Germany
PMI Services
Value
Sep P
53.50
7:30 PM US
Consumer Confidence
S.A./ 1985=100
Sep
122.90
Sep 26, 2017
1:00 PM Germany
PMI Manufacturing
Value
Sep P
59.30
7:30 PM US
New home sales
Thousands
Aug
571.00
Sep 28, 2017
6:00 PM US
GDP Qoq (Annualise d)
% Change
2Q T
3.00
Sep 29, 2017
1:25 PM Germany
Unempl oyment change (000's)
Thousands
Sep
(5.00)
2:00 PM UK
GDP (YoY)
% Change
2Q F
1.70
Sep 30, 2017
6:30 AM China
PMI Manufacturing
Value
Sep
51.70
Oct 02, 2017
2:00 PM UK
PMI Manufacturing
Value
Sep
56.90
Oct 04, 2017
2:30 PM India
RBI Reverse Re po rate
%
Oct 4
5.75
Source: Bloomberg, Angel Research
Market Outlook
September 14, 2017
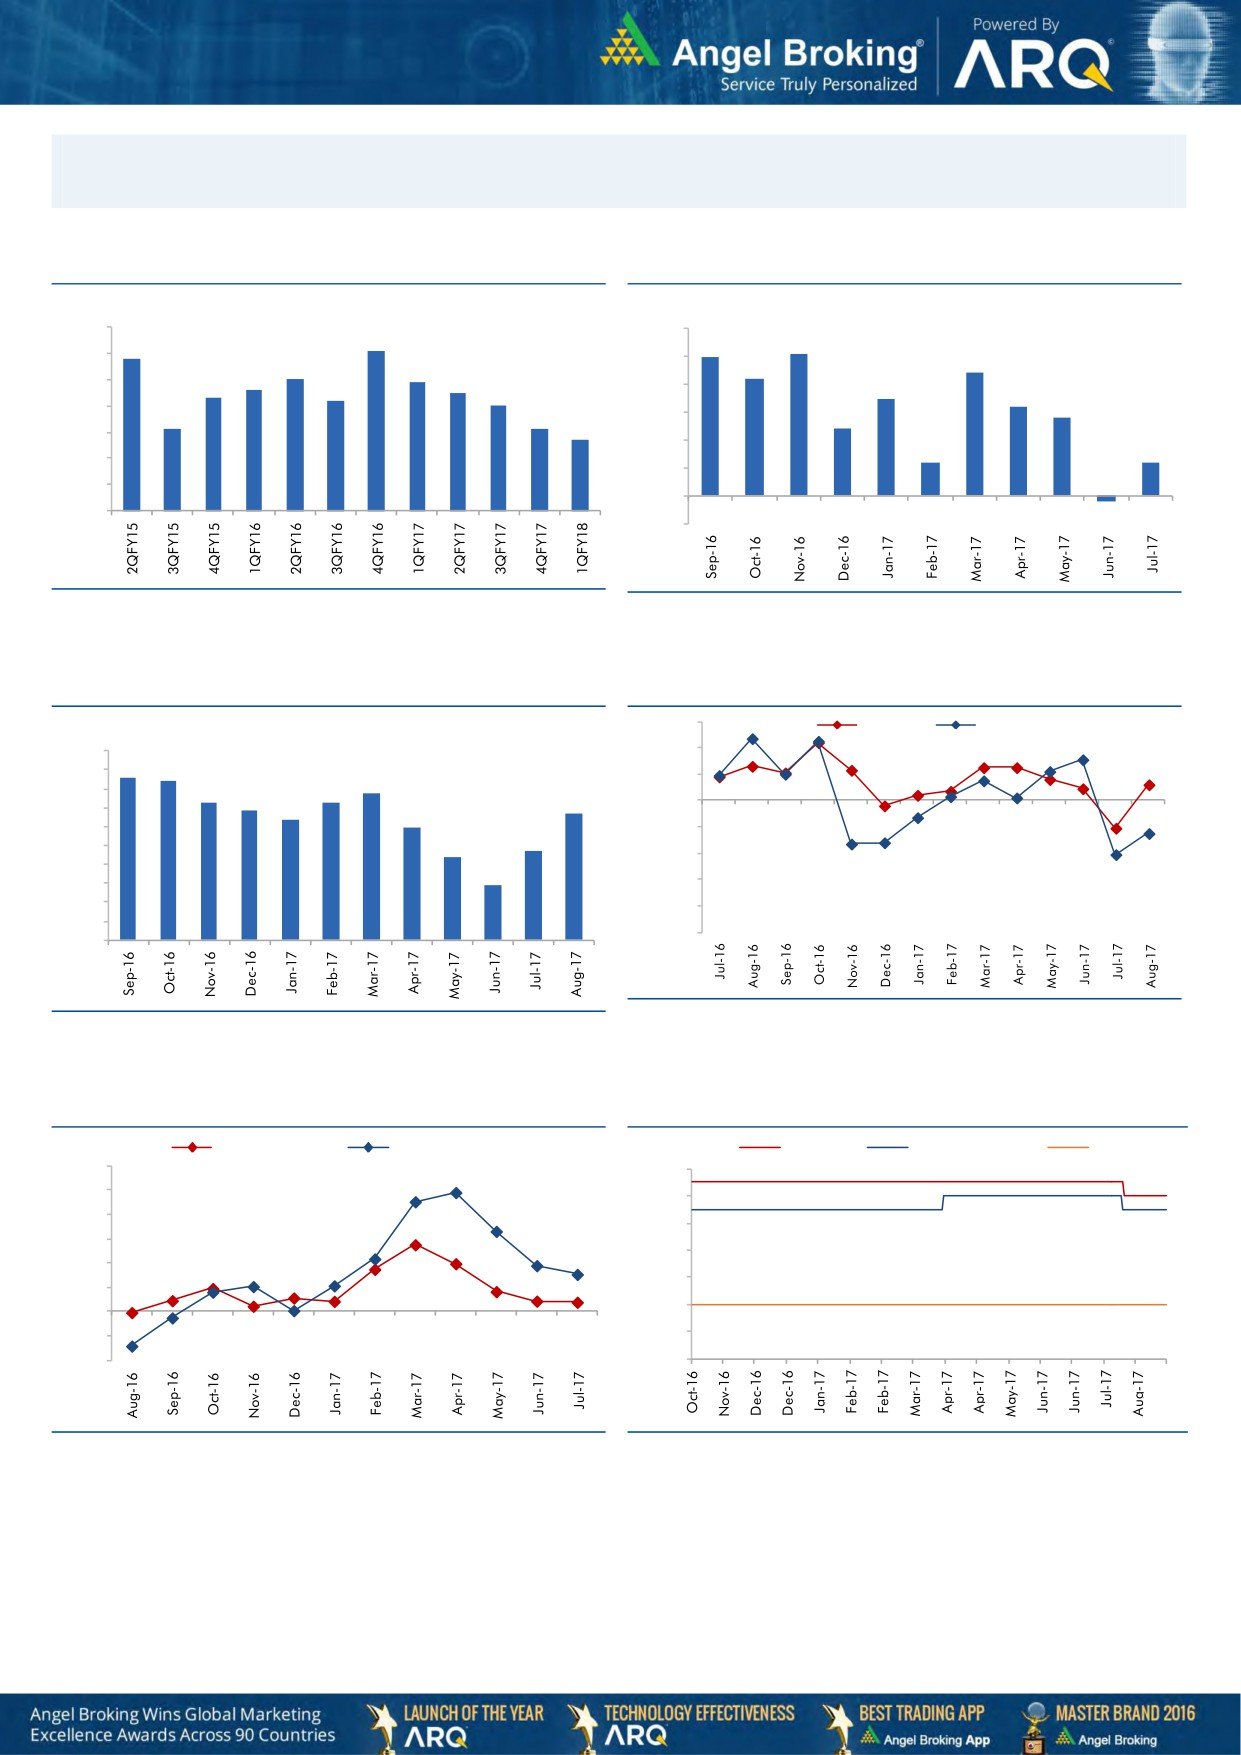
Macro watch
Exhibit 1: Quarterly GDP trends
Exhibit 2: IIP trends
(%)
(%)
10.0
6.0
9.1
5.1
8.8
5.0
9.0
5.0
4.4
8.0
7.9
4.2
7.6
7.5
8.0
7.3
7.2
4.0
3.5
7.0
3.2
2.8
7.0
6.1
6.1
3.0
2.4
5.7
6.0
2.0
1.2
1.2
5.0
1.0
4.0
-
3.0
(1.0)
(0.2)
Source: CSO, Angel Research
Source: MOSPI, Angel Research
Exhibit 3: Monthly CPI inflation trends
Exhibit 4: Manufacturing and services PMI
56.0
Mfg. PMI
Services PMI
(%)
5.0
54.0
4.3
4.2
4.5
3.9
52.0
4.0
3.6
3.7
3.4
3.4
3.2
50.0
3.5
3.0
3.0
48.0
2.4
2.2
2.5
46.0
2.0
1.5
1.5
44.0
1.0
42.0
0.5
40.0
-
Source: Market, Angel Research; Note: Level above 50 indicates expansion
Source: MOSPI, Angel Research
Exhibit 5: Exports and imports growth trends
Exhibit 6: Key policy rates
(%)
Exports yoy growth
Imports yoy growth
(%)
Repo rate
Reverse Repo rate
CRR
60.0
6.50
50.0
6.00
40.0
5.50
30.0
5.00
20.0
4.50
10.0
4.00
0.0
(10.0)
3.50
(20.0)
3.00
Source: Bloomberg, Angel Research
Source: RBI, Angel Research
Market Outlook
September 14, 2017
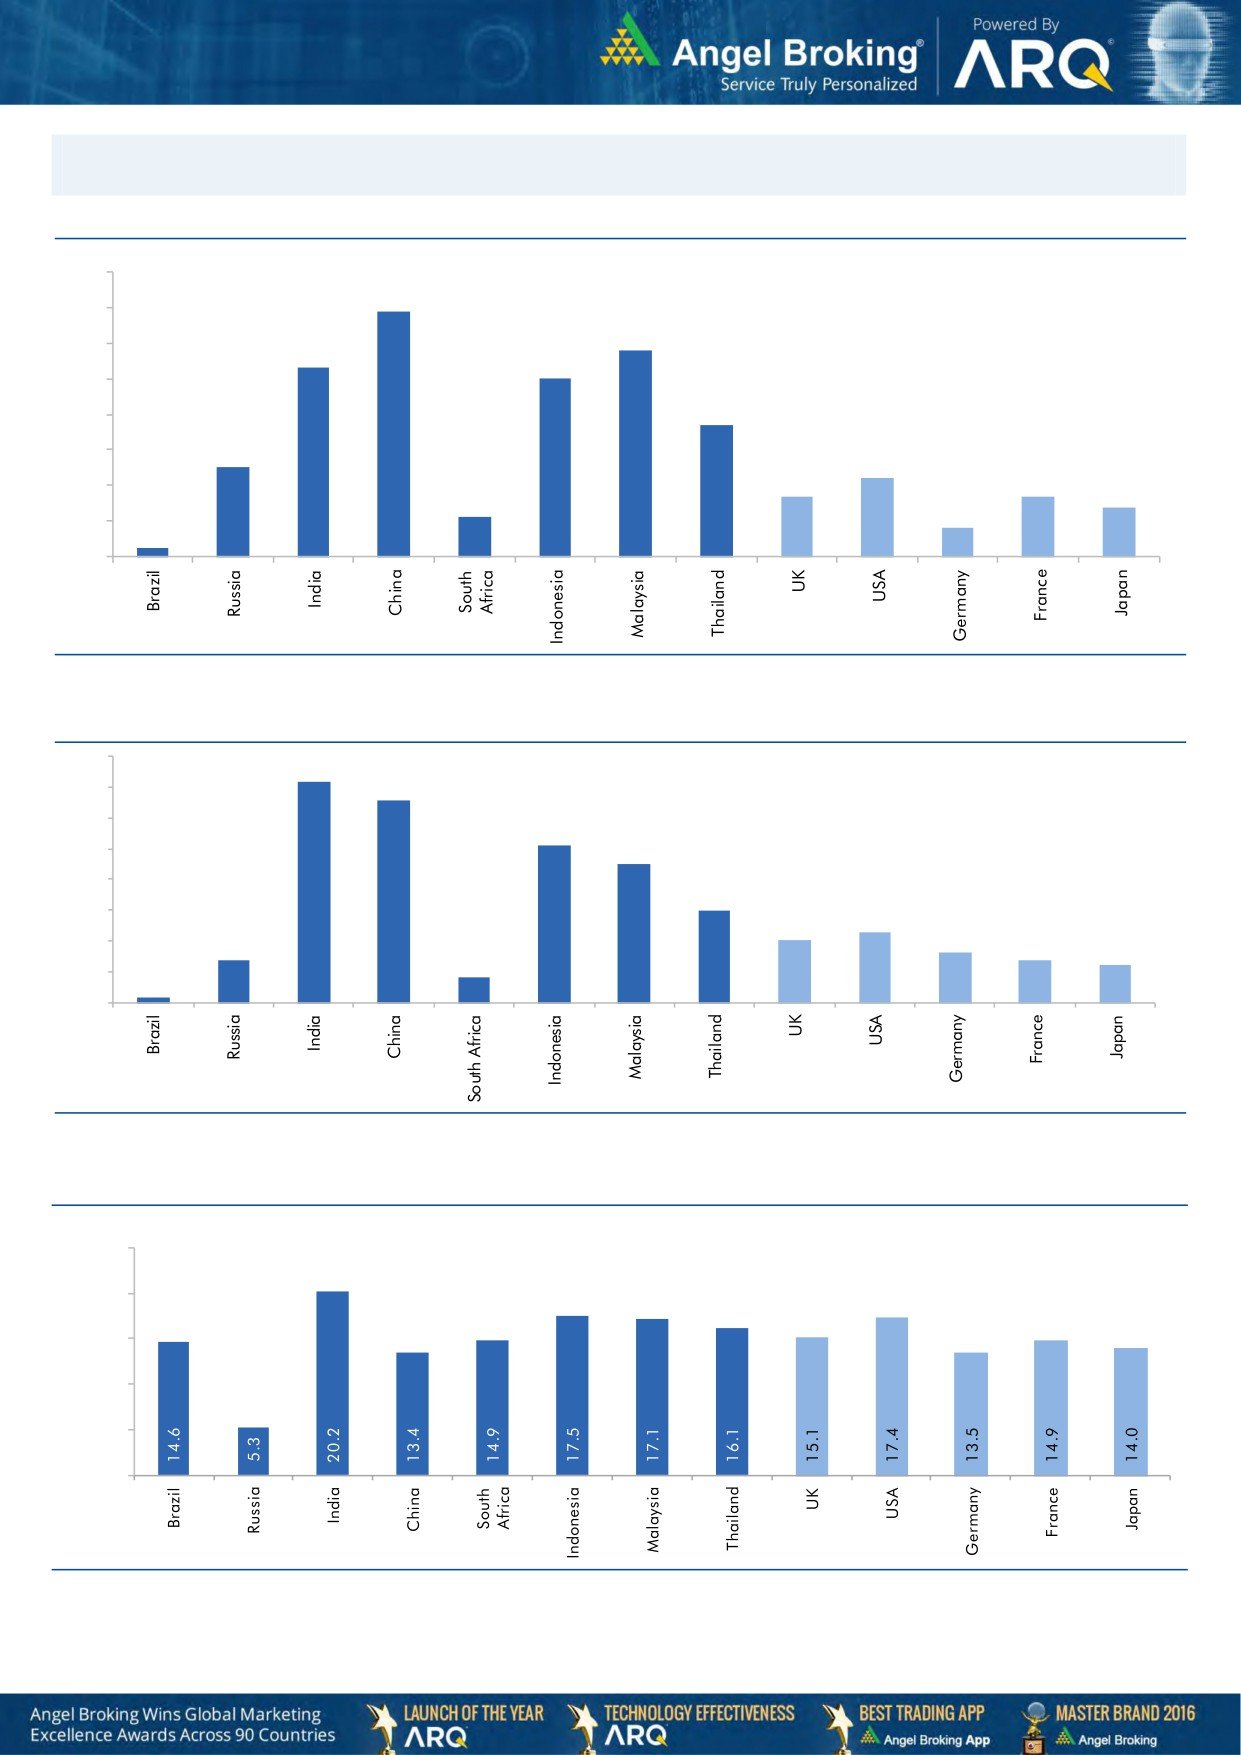
Global watch
Exhibit 1: Latest quarterly GDP Growth (%, yoy) across select developing and developed countries
(%)
8.0
6.9
7.0
5.8
6.0
5.3
5.0
5.0
1.1
3.7
4.0
2.5
3.0
2.2
1.7
1.7
2.0
1.4
0.8
1.0
0.3
-
Source: Bloomberg, Angel Research
Exhibit 2: 2017 GDP Growth projection by IMF (%, yoy) across select developing and developed countries
(%)
7.2
6.6
7.0
6.0
5.1
5.0
4.5
4.0
3.0
3.0
2.3
2.0
1.4
1.6
2.0
1.4
1.2
0.2
0.8
1.0
-
Source: IMF, Angel Research
Exhibit 3: One year forward P-E ratio across select developing and developed countries
(x)
25.0
20.0
15.0
10.0
5.0
-
Source: IMF, Angel Research
Market Outlook
September 14, 2017
Exhibit 4: Relative performance of indices across globe
Returns (%)
C ountry
Name of index
Closing price
1M
3M
1YR
Brazil
Bovespa
74,788
11.0
21.0
28.9
Russia
Micex
2,054
5.2
13.0
2.9
India
Nifty
10,079
2.6
4.8
12.6
China
Shanghai Composite
3,384
4.2
8.4
10.4
South Africa
Top 40
49,784
1.4
10.0
7.5
Mexico
Mexbol
50,165
(2.0)
2.1
9.6
Indonesia
LQ45
973
2.1
2.1
5.8
Malaysia
KLCI
1,786
0.5
0.0
6.8
Thailand
SET 50
1,049
5.4
6.5
11.2
USA
Dow Jones
22,158
1.4
3.9
22.9
UK
FTSE
7,380
1.0
(1.3)
9.6
Japan
Nikkei
19,866
1.7
(0.2)
16.3
Germany
DAX
12,554
3.2
(1.1)
21.0
France
CAC
5,218
1.9
0.0
18.3
Source: Bloomberg, Angel Research
Stock Watch
September 14, 2017
Company Name
Reco
CMP
Target
Mkt Cap
Sales ( Čcr )
OPM(%)
EPS (Č)
PER(x)
P/BV(x)
RoE(%)
EV/Sales(x)
(Č)
Price ( Č)
( Č cr )
FY18E FY19E
FY18E
FY19E
FY18E
FY19E
FY18E
FY19E
FY18E
FY19E
FY18E
FY19E
FY18E
FY19E
Agri / Agri Chemical
Rallis
Reduce
225
209
4,382
1,873
2,099
15.0
15.0
9.5
10.5
23.7
21.5
3.6
3.3
15.8
16.0
2.2
2.0
United Phosphorus
Neutral
811
-
41,187
18,922
21,949
18.0
18.5
36.2
45.6
22.4
17.8
4.7
3.9
22.7
23.8
2.3
2.0
Auto & Auto Ancillary
Ashok Leyland
Accumulate
118
127
34,416
23,339
27,240
10.1
10.8
4.7
6.2
25.3
18.9
5.1
4.5
20.0
23.6
1.4
1.2
Bajaj Auto
Accumulate
2,931
3,151
84,821
23,936
27,955
19.5
20.1
142.7
167.3
20.5
17.5
4.5
4.0
21.8
22.8
3.1
2.6
Bharat Forge
Neutral
1,226
-
28,541
7,637
8,755
21.7
23.2
36.1
47.3
34.0
26.0
6.1
5.2
18.5
20.8
3.6
3.1
Eicher Motors
Neutral
32,226
-
87,728
19,043
22,837
19.5
19.9
835.4
1,019.0
38.6
31.6
14.4
11.1
40.9
37.8
4.5
3.7
Gabriel India
Neutral
209
-
2,999
1,782
2,033
9.7
10.2
7.1
8.9
29.4
23.6
5.9
5.0
21.0
22.2
1.6
1.4
Hero Motocorp
Accumulate
3,896
4,129
77,792
32,239
36,878
16.0
15.6
184.4
206.5
21.1
18.9
6.6
5.8
31.3
30.7
2.2
1.9
Jamna Auto Industries Neutral
258
-
2,058
1,441
1,662
14.4
14.8
13.9
17.6
18.6
14.7
5.1
4.1
30.0
31.0
1.4
1.2
Mahindra and Mahindra Neutral
1,304
-
81,012
46,971
53,816
13.6
14.0
67.7
79.8
19.3
16.4
2.8
2.5
15.0
15.9
1.6
1.4
Maruti
Accumulate
8,121
8,658
245,321
81,825
101,245
15.0
15.0
283.5
356.0
28.7
22.8
6.3
5.1
21.9
22.4
2.7
2.1
Minda Industries
Neutral
865
-
7,475
4,328
5,084
11.0
11.9
27.3
36.4
31.7
23.8
6.7
5.3
23.1
25.6
1.8
1.5
Motherson Sumi
Neutral
333
-
70,113
55,937
64,445
10.8
11.4
16.9
21.1
19.7
15.8
4.4
4.5
25.2
25.4
1.3
1.1
Tata Motors
Neutral
390
-
112,549
303,167
343,649
11.8
13.8
33.1
54.7
11.8
7.1
1.9
1.5
16.9
23.0
0.4
0.3
TVS Motor
Neutral
638
-
30,311
13,992
16,216
9.0
9.4
17.1
20.3
37.4
31.4
9.9
7.7
29.7
27.7
2.1
1.8
Amara Raja Batteries
Accumulate
781
858
13,347
6,140
7,122
14.3
15.6
29.3
39.0
26.7
20.0
4.6
3.8
17.1
19.0
2.2
1.9
Exide Industries
Neutral
218
-
18,530
8,689
9,854
15.1
15.2
9.7
11.0
22.6
19.8
4.0
3.5
15.7
16.1
1.9
1.6
Apollo Tyres
Neutral
260
-
13,219
15,739
17,326
13.3
14.6
20.4
26.7
12.7
9.7
1.5
1.4
20.4
26.7
1.1
1.0
Ceat
Neutral
1,761
-
7,123
6,661
7,717
11.1
14.2
116.2
178.2
15.2
9.9
2.6
2.2
15.2
21.3
1.2
1.0
JK Tyres
Neutral
150
-
3,404
8,318
9,239
16.2
16.4
21.0
27.5
7.2
5.5
1.4
1.1
19.1
20.4
0.9
0.7
Swaraj Engines
Neutral
2,053
-
2,551
788
889
16.4
16.5
71.6
81.0
28.7
25.4
8.3
7.7
29.6
31.0
2.9
2.5
Subros
Neutral
239
-
1,435
1,855
2,135
11.6
11.8
10.3
14.7
23.3
16.3
3.6
3.0
15.8
19.1
1.0
0.8
Capital Goods
BEML
Neutral
1,847
-
7,692
4,286
5,194
7.1
8.2
42.9
58.1
43.1
31.8
3.5
3.2
7.6
8.7
1.9
1.5
Bharat Electronics
Neutral
195
-
43,522
10,258
12,470
19.6
19.5
7.3
8.6
26.7
22.7
0.5
0.5
20.4
21.9
3.7
3.0
Voltas
Neutral
549
-
18,167
6,778
8,004
9.6
11.0
17.1
22.4
32.1
24.5
7.7
6.7
17.7
19.8
2.4
2.0
BHEL
Neutral
133
-
32,443
33,200
39,167
6.8
9.5
6.2
11.2
21.4
11.8
1.0
0.9
4.6
8.0
0.6
0.4
Blue Star
Accumulate
795
850
7,616
5,101
5,997
6.0
7.0
17.9
26.6
44.4
29.9
9.5
8.6
21.9
29.0
1.5
1.3
CG Power and Industrial
Neutral
85
-
5,349
6,555
7,292
7.5
7.5
-
0.8
8,535.0
106.7
1.3
1.3
0.1
1.2
0.9
0.8
Solutions
Greaves Cotton
Neutral
145
-
3,537
1,778
1,993
14.7
15.1
8.1
9.1
17.9
15.9
4.0
3.8
21.8
23.6
1.8
1.6
Stock Watch
September 14, 2017
Company Name
Reco
CMP
Target
Mkt Cap
Sales ( Čcr )
OPM(%)
EPS (Č)
PER(x)
P/BV(x)
RoE(%)
EV/Sales(x)
(Č)
Price ( Č)
( Č cr )
FY18E FY19E
FY18E
FY19E
FY18E
FY19E
FY18E
FY19E
FY18E
FY19E
FY18E
FY19E
FY18E
FY19E
Capital Goods
KEC International
Accumulate
323
350
8,298
9,779
11,113
9.4
9.8
14.2
18.2
22.7
17.7
4.4
3.6
21.1
22.1
1.1
1.0
KEI Industries
Buy
299
371
2,325
3,001
3,391
10.0
10.0
13.0
16.1
23.0
18.6
4.2
3.5
18.2
18.7
1.0
0.8
Thermax
Neutral
899
-
10,707
4,125
4,747
10.3
10.8
26.7
31.5
33.7
28.5
3.8
3.4
11.2
12.0
2.3
2.0
VATech Wabag
Accumulate
635
681
3,467
3,867
4,126
9.6
10.0
34.9
39.8
18.2
16.0
3.0
2.6
17.7
17.5
0.9
0.8
Cement
ACC
Neutral
1,840
-
34,561
12,255
13,350
13.5
14.3
58.0
66.2
31.7
27.8
3.8
3.5
11.5
12.2
2.8
2.6
Ambuja Cements
Neutral
286
-
56,730
10,250
11,450
17.5
19.0
7.2
8.3
39.7
34.4
2.8
2.7
7.0
7.8
5.3
4.7
India Cements
Neutral
189
-
5,829
6,135
6,750
14.8
15.2
8.5
11.5
22.3
16.5
1.1
1.1
4.8
6.2
1.3
1.1
JK Cement
Neutral
1,053
-
7,361
4,150
4,775
19.2
20.0
49.0
63.5
21.5
16.6
3.4
2.9
17.0
18.5
2.2
1.9
J K Lakshmi Cement
Neutral
425
-
5,000
3,422
3,757
15.5
17.0
13.5
23.2
31.5
18.3
3.3
2.8
10.8
15.5
1.9
1.6
Orient Cement
Neutral
163
-
3,343
2,215
3,233
16.8
17.0
5.9
6.9
27.7
23.7
2.1
2.0
10.8
10.1
2.5
1.7
UltraTech Cement
Neutral
4,173
-
114,566
28,250
35,150
20.2
23.5
77.5
122.2
53.9
34.2
4.5
4.1
9.6
14.8
4.5
3.6
Construction
KNR Constructions
Neutral
201
-
2,825
1,846
2,203
14.5
14.5
12.1
13.7
16.6
14.7
0.9
0.8
17.5
16.7
1.6
1.3
Larsen & Toubro
Neutral
1,223
-
171,252
95,787
109,476
10.2
11.6
44.5
50.8
27.5
24.1
3.4
3.2
12.9
13.1
2.3
2.1
Gujarat Pipavav Port
Neutral
147
-
7,090
739
842
61.6
62.7
5.1
6.2
28.8
23.9
3.6
3.5
12.7
14.9
9.1
7.8
PNC Infratech
Accumulate
135
143
3,457
2,040
2,935
13.0
13.0
6.4
9.0
21.1
15.0
0.6
0.5
9.7
12.2
1.7
1.2
Simplex Infra
Neutral
477
-
2,360
6,012
6,619
11.6
11.7
21.1
31.0
22.7
15.4
1.6
1.4
6.5
8.6
0.9
0.8
Sadbhav Engineering
Neutral
297
-
5,101
3,823
4,426
10.7
10.8
10.3
11.8
28.9
25.2
3.5
3.0
10.1
10.5
1.7
1.4
NBCC
Neutral
210
-
18,914
9,099
12,706
6.4
6.4
7.3
9.6
28.9
22.0
1.3
1.0
27.5
30.5
1.9
1.4
MEP Infra
Neutral
110
-
1,781
2,403
2,910
18.3
16.8
2.4
6.1
46.6
18.0
17.7
11.9
35.2
55.8
1.9
1.6
SIPL
Neutral
100
-
3,529
2,060
2,390
46.8
47.7
(5.8)
(3.1)
3.8
4.3
(14.2)
(2.3)
6.5
6.1
Engineers India
Neutral
159
-
10,688
1,795
2,611
21.1
22.4
5.9
8.1
26.9
19.6
1.9
1.9
12.9
16.1
4.3
2.8
Financials
Axis Bank
Buy
499
580
119,592
32,558
35,843
3.5
3.2
27.8
41.0
17.9
12.2
1.9
1.7
11.4
14.9
-
-
Bank of Baroda
Neutral
144
-
33,145
22,533
26,079
2.4
2.4
12.0
20.9
12.0
6.9
0.8
0.7
6.6
11.0
-
-
Canara Bank
Neutral
340
-
20,323
17,925
20,235
2.0
2.1
18.5
36.5
18.4
9.3
0.7
0.7
3.4
6.2
-
-
Can Fin Homes
Neutral
2,808
-
7,474
586
741
3.5
3.5
107.8
141.0
26.0
19.9
5.7
4.6
24.1
25.6
-
-
Cholamandalam Inv. &
Accumulate
1,171
1,230
18,302
2,826
3,307
6.3
6.3
53.7
64.6
21.8
18.1
3.7
3.2
18.3
18.9
-
-
Fin. Co.
Dewan Housing Finance Accumulate
552
610
17,311
2,676
3,383
2.4
2.7
37.4
49.7
14.8
11.1
1.9
1.7
13.8
16.2
-
-
Equitas Holdings
Buy
167
235
5,653
1,125
1,380
9.6
9.8
1.5
6.0
111.2
27.8
2.5
2.4
2.4
8.2
-
-
Federal Bank
Accumulate
113
125
22,032
4,896
5,930
2.8
3.1
5.4
7.6
21.1
14.9
1.8
1.6
8.5
11.0
-
-
Stock Watch
September 14, 2017
Company Name
Reco
CMP
Target
Mkt Cap
Sales ( Čcr )
OPM(%)
EPS (Č)
PER(x)
P/BV(x)
RoE(%)
EV/Sales(x)
(Č)
Price ( Č)
( Č cr )
FY18E FY19E
FY18E
FY19E
FY18E
FY19E
FY18E
FY19E
FY18E
FY19E
FY18E
FY19E
FY18E
FY19E
Financials
GIC Housing
Buy
527
655
2,839
376
477
3.6
3.7
33.0
40.0
16.0
13.2
2.9
2.4
20.0
23.0
-
-
HDFC Bank
Neutral
1,843
-
475,647
55,236
63,253
4.5
4.4
68.9
82.4
26.8
22.4
4.7
3.9
18.7
18.5
-
-
ICICI Bank
Accumulate
292
315
187,311
42,361
51,378
3.6
3.9
18.4
25.7
15.9
11.4
1.7
1.7
11.3
15.0
-
-
Karur Vysya Bank
Buy
150
180
9,089
3,289
3,630
3.7
3.9
10.8
14.1
13.9
10.7
1.7
1.5
12.5
14.7
-
-
LIC Housing Finance
Neutral
660
-
33,323
4,895
6,332
3.4
3.7
50.7
66.8
13.0
9.9
2.6
2.2
21.7
23.8
-
-
Punjab Natl.Bank
Neutral
143
-
30,398
23,708
25,758
2.1
2.1
5.9
16.4
24.3
8.7
0.7
0.7
3.0
8.3
-
-
RBL Bank
Neutral
534
-
22,061
2,309
2,888
2.6
2.5
16.4
19.1
32.6
28.0
4.1
3.6
13.3
13.8
-
-
Repco Home Finance
Buy
662
825
4,140
496
597
4.4
4.2
38.5
48.7
17.2
13.6
3.1
2.6
19.6
20.6
-
-
South Ind.Bank
Neutral
29
-
5,197
3,195
3,567
3.0
3.1
3.0
3.8
9.5
7.5
1.0
0.8
10.5
11.9
-
-
St Bk of India
Neutral
273
-
235,957
105,827
121,056
2.4
2.5
16.1
25.6
17.0
10.7
1.3
1.2
6.6
9.9
-
-
Union Bank
Neutral
136
-
9,894
14,650
16,225
2.3
2.3
23.1
32.5
5.9
4.2
0.5
0.4
7.1
9.2
-
-
Yes Bank
Neutral
1,841
-
84,334
11,088
13,138
3.0
2.9
84.0
99.3
21.9
18.5
3.4
2.9
16.3
16.8
-
-
FMCG
Akzo Nobel India
Neutral
1,817
-
8,714
3,164
3,607
13.8
13.7
58.6
67.9
31.0
26.7
7.6
6.7
24.5
25.1
2.6
2.3
Asian Paints
Neutral
1,252
-
120,116
17,603
20,615
18.6
18.6
2,128.9
2,543.3
0.6
0.5
12.4
10.4
28.0
28.9
6.6
5.6
Britannia
Neutral
4,325
-
51,920
9,690
11,278
14.8
15.4
84.0
101.0
51.5
42.8
18.8
14.9
40.6
39.0
5.3
4.6
Colgate
Neutral
1,144
-
31,115
4,420
5,074
24.9
25.3
28.6
32.8
40.0
34.9
15.8
12.7
43.8
40.5
6.8
5.9
Dabur India
Neutral
308
-
54,255
8,346
9,344
19.6
19.9
7.8
9.0
39.5
34.2
8.0
7.2
25.2
24.8
6.1
5.4
GlaxoSmith Con*
Neutral
5,092
-
21,413
5,072
5,760
18.2
18.4
176.3
199.2
28.9
25.6
6.1
5.5
21.2
21.7
3.5
3.1
Godrej Consumer
Neutral
939
-
63,997
10,171
11,682
20.8
21.5
21.7
27.1
43.3
34.7
9.7
8.4
22.3
23.4
6.4
5.5
HUL
Neutral
1,251
-
270,722
37,077
41,508
20.3
21.8
5,189.9
6,318.5
0.2
0.2
38.1
32.6
74.8
82.0
7.2
6.4
ITC
Neutral
272
-
330,695
44,588
49,853
37.0
37.3
9.6
11.0
28.3
24.7
6.9
6.6
25.1
27.3
6.9
6.1
Marico
Neutral
338
-
43,592
6,788
7,766
18.5
19.2
7.1
8.5
47.6
39.7
16.6
14.3
36.9
38.0
6.3
5.5
Nestle*
Neutral
7,253
-
69,934
10,083
11,182
20.0
20.9
119.7
141.3
60.6
51.3
213.6
195.2
36.7
39.8
6.6
5.9
Tata Global
Neutral
207
-
13,083
7,121
7,641
11.9
12.3
6.9
8.0
30.0
25.9
2.0
1.9
6.8
7.2
1.6
1.5
Procter & Gamble
Neutral
8,349
-
27,103
3,034
3,579
27.1
27.7
167.7
198.8
49.8
42.0
13.4
11.5
28.8
29.5
8.4
7.0
Hygiene
IT
HCL Tech^
Buy
871
1,014
124,269
52,342
57,053
20.9
20.9
62.8
67.6
13.9
12.9
3.1
2.7
22.4
20.6
2.0
1.8
Infosys
Buy
884
1,179
202,949
73,963
80,619
26.0
26.0
64.4
69.3
13.7
12.8
2.7
2.5
19.7
19.6
2.2
1.9
TCS
Accumulate
2,488
2,651
490,262
127,403
138,870
27.6
27.6
144.5
156.0
17.2
16.0
5.1
4.8
29.7
29.8
3.5
3.2
Tech Mahindra
Buy
440
533
42,886
31,015
33,496
15.0
15.0
35.6
38.1
12.4
11.5
2.1
2.0
17.0
16.3
1.2
1.0
Stock Watch
September 14, 2017
Company Name
Reco
CMP
Target
Mkt Cap
Sales ( Čcr )
OPM(%)
EPS (Č)
PER(x)
P/BV(x)
RoE(%)
EV/Sales(x)
(Č)
Price ( Č)
( Č cr )
FY18E FY19E
FY18E
FY19E
FY18E
FY19E
FY18E
FY19E
FY18E
FY19E
FY18E
FY19E
FY18E
FY19E
IT
Wipro
Neutral
296
-
144,078
58,536
61,858
20.3
20.3
18.2
19.1
16.3
15.5
2.5
2.2
14.6
13.4
2.4
2.3
Media
D B Corp
Neutral
365
-
6,714
2,404
2,625
30.5
31.5
23.7
26.9
15.4
13.6
3.6
3.1
23.5
22.8
2.6
2.4
HT Media
Neutral
97
-
2,255
2,589
2,830
15.1
15.4
8.3
10.9
11.7
8.9
0.9
0.9
8.4
10.4
0.4
0.3
Jagran Prakashan
Buy
179
225
5,857
2,541
2,835
28.5
28.7
12.7
14.1
14.1
12.7
2.9
2.5
21.3
21.4
2.2
1.9
Sun TV Network
Neutral
813
-
32,047
3,238
3,789
51.9
55.1
30.9
38.0
26.3
21.4
7.5
6.6
30.0
31.0
9.4
7.9
Hindustan Media
Neutral
260
-
1,905
1,002
1,074
23.3
23.5
29.2
33.8
8.9
7.7
1.4
1.2
15.6
15.4
0.9
0.6
Ventures
TV Today Network
Buy
264
344
1,575
667
727
27.7
27.7
18.6
20.1
14.2
13.2
2.2
2.3
15.6
17.3
1.9
1.8
Music Broadcast Limited Accumulate
400
434
2,283
271
317
91.0
109.0
6.0
10.0
66.7
40.0
4.2
3.8
6.5
9.3
8.0
6.6
Metals & Mining
Coal India
Neutral
256
-
158,972
82,301
91,235
17.0
18.0
17.1
20.5
15.0
12.5
2.8
2.6
45.0
55.0
1.6
1.4
Hind. Zinc
Neutral
307
-
129,675
22,108
24,555
57.0
58.0
22.1
26.3
13.9
11.7
4.5
3.6
32.0
35.0
4.9
4.1
Hindalco
Neutral
248
-
55,653
102,350
105,355
13.5
14.5
21.5
24.5
11.5
10.1
1.6
1.3
15.0
15.2
1.1
1.1
JSW Steel
Neutral
264
-
63,778
64,500
68,245
21.1
21.5
20.1
21.2
13.1
12.5
2.4
2.1
-
-
1.7
1.6
NMDC
Neutral
133
-
42,096
10,209
11,450
47.0
48.0
11.1
12.1
12.0
11.0
1.7
1.6
-
-
3.6
3.3
SAIL
Neutral
62
-
25,545
54,100
63,555
3.0
10.0
(10.0)
1.5
41.2
0.8
0.8
-
-
1.5
1.3
Vedanta
Neutral
327
-
121,589
81,206
87,345
28.0
29.0
26.5
33.5
12.3
9.8
2.8
2.4
-
-
2.2
1.9
Tata Steel
Neutral
680
-
66,014
121,445
126,500
16.2
17.2
65.4
81.3
10.4
8.4
1.7
1.4
-
-
1.1
0.9
Oil & Gas
GAIL
Neutral
407
-
68,912
53,115
52,344
14.2
15.3
30.0
31.1
13.6
13.1
1.7
1.6
-
-
1.0
1.0
ONGC
Neutral
161
-
206,872
83,111
84,934
44.2
44.9
16.4
16.9
9.8
9.5
1.2
1.1
-
-
2.4
2.3
Indian Oil Corp
Neutral
416
-
201,981
396,116
432,560
8.5
8.8
40.1
42.2
10.4
9.9
1.8
1.6
-
-
0.7
0.6
Reliance Industries
Neutral
849
-
552,238
257,711
267,438
17.0
18.2
89.1
89.5
9.5
9.5
0.9
0.8
-
-
1.8
1.7
Pharmaceuticals
Alembic Pharma
Buy
511
600
9,626
3,903
4,584
18.2
19.2
21.8
27.2
23.4
18.8
4.3
3.5
19.8
20.6
2.5
2.1
Alkem Laboratories Ltd
Buy
1,800
2,161
21,526
6,901
7,850
18.4
19.1
85.0
100.5
21.2
17.9
4.3
3.6
20.2
20.1
3.1
2.7
Aurobindo Pharma
Accumulate
759
823
44,489
17,086
19,478
22.1
22.0
44.7
51.4
17.0
14.8
3.8
3.0
24.7
22.7
2.7
2.4
Aventis*
Neutral
4,060
-
9,351
2,508
2,862
16.8
16.8
139.9
153.8
29.0
26.4
4.2
3.4
23.5
25.8
3.3
2.7
Cadila Healthcare
Reduce
481
426
49,257
11,584
13,228
20.3
20.4
18.7
21.3
25.7
22.6
5.7
4.7
24.6
22.9
4.1
3.5
Cipla
Sell
554
458
44,604
16,619
19,437
15.4
16.2
19.7
24.3
28.1
22.8
3.2
2.8
12.0
13.2
2.8
2.4
Dr Reddy's
Neutral
2,210
-
36,642
15,844
17,973
17.6
18.2
91.7
111.0
24.1
19.9
2.7
2.5
11.9
13.0
2.5
2.2
GSK Pharma*
Neutral
2,415
-
20,458
3,260
3,651
15.0
18.0
46.1
58.6
52.4
41.2
10.8
11.1
20.0
26.5
6.2
5.6
Indoco Remedies
Sell
198
153
1,823
1,154
1,310
14.9
14.9
11.3
12.7
17.5
15.6
2.5
2.2
15.0
15.0
1.7
1.4
Stock Watch
September 14, 2017
Company Name
Reco
CMP
Target
Mkt Cap
Sales ( Čcr )
OPM(%)
EPS (Č)
PER(x)
P/BV(x)
RoE(%)
EV/Sales(x)
(Č)
Price ( Č)
( Č cr )
FY18E FY19E
FY18E
FY19E
FY18E
FY19E
FY18E
FY19E
FY18E
FY19E
FY18E
FY19E
FY18E
FY19E
Pharmaceuticals
Ipca labs
Accumulate
478
540
6,030
3,593
4,022
14.5
15.5
19.4
25.2
24.6
19.0
2.3
2.0
9.5
11.2
1.7
1.6
Lupin
Buy
992
1,467
44,823
18,657
21,289
21.3
23.3
52.8
66.7
18.8
14.9
2.8
2.4
16.3
17.5
2.4
2.0
Natco Pharma
Neutral
767
-
13,369
1,836
1,946
31.8
28.9
22.1
20.6
34.7
37.2
7.0
6.2
20.1
16.7
7.1
6.7
Sun Pharma
Accumulate
503
558
120,670
32,899
36,451
26.9
25.4
31.6
32.3
15.9
15.6
2.8
2.4
18.7
18.8
3.3
2.8
Syngene International
Buy
467
557
9,333
1,402
1,823
32.8
36.0
15.9
20.7
29.4
22.6
5.5
4.5
18.7
20.0
6.6
5.1
Power
Tata Power
Neutral
85
-
22,936
32,547
33,806
20.5
20.5
4.7
5.4
18.0
15.9
1.7
1.5
10.5
10.5
1.7
1.6
NTPC
Neutral
169
-
139,266
86,070
101,246
28.3
30.7
12.9
16.2
13.1
10.4
1.4
1.3
10.6
12.4
3.0
2.7
Power Grid
Neutral
214
-
111,825
29,183
32,946
89.7
90.0
18.0
20.8
11.9
10.3
2.0
1.8
17.7
18.2
7.8
7.2
Real Estate
Prestige Estate
Neutral
257
-
9,647
4,607
5,146
21.0
22.2
7.9
9.8
32.6
26.3
2.0
1.9
10.3
12.0
3.3
3.0
MLIFE
Buy
450
522
2,308
487
590
12.3
17.8
21.0
31.2
21.4
14.4
1.1
1.1
5.2
7.4
3.5
2.8
Telecom
Bharti Airtel
Neutral
401
-
160,296
97,903
105,233
36.0
36.3
9.3
11.1
43.1
36.3
2.1
2.0
5.0
5.6
2.6
2.3
Idea Cellular
Neutral
83
-
29,793
35,012
37,689
27.1
27.7
(4.4)
(2.7)
1.3
1.3
(6.8)
(4.6)
2.2
1.9
zOthers
Abbott India
Neutral
4,117
-
8,747
3,244
3,723
14.9
16.1
167.5
209.4
24.6
19.7
5.4
4.5
23.7
24.8
2.3
2.0
Asian Granito
Accumulate
451
493
1,358
1,169
1,286
12.5
12.5
16.0
19.7
28.2
22.9
3.0
2.7
10.7
11.6
1.4
1.2
Bajaj Electricals
Accumulate
373
395
3,784
4,646
5,301
6.7
7.6
16.1
22.3
23.2
16.7
3.8
3.2
16.4
19.2
0.8
0.7
Banco Products (India)
Neutral
219
-
1,568
1,530
1,695
13.2
12.7
19.0
20.0
11.5
11.0
1.8
1.6
0.2
0.2
0.9
103.8
Coffee Day Enterprises
Neutral
248
-
5,108
3,494
3,913
17.4
18.0
4.8
5.7
-
43.5
2.2
2.1
-
0.1
1.9
1.7
Ltd
Elecon Engineering
Neutral
53
-
599
171
201
15.0
16.2
36.0
43.0
1.5
1.2
0.1
0.1
0.1
0.1
2.9
2.4
Garware Wall Ropes
Neutral
894
-
1,957
928
1,003
15.2
15.2
39.4
43.2
22.7
20.7
3.7
3.2
16.5
15.4
2.0
1.8
Goodyear India*
Neutral
830
-
1,913
1,717
1,866
11.8
12.3
47.9
49.8
17.3
16.7
2.7
2.3
15.6
15.7
0.8
115.9
Hitachi
Neutral
1,936
-
5,265
2,355
2,715
10.3
10.8
49.0
60.9
39.5
31.8
9.3
7.3
0.2
0.2
2.3
1.9
HSIL
Neutral
383
-
2,771
2,240
2,670
14.6
15.0
17.0
22.0
22.5
17.4
1.9
1.8
0.1
0.1
1.5
1.2
Interglobe Aviation
Neutral
1,199
-
43,348
22,570
27,955
14.2
15.0
63.6
81.8
18.9
14.7
9.9
8.4
0.5
0.6
1.6
1.2
Jyothy Laboratories
Neutral
410
-
7,453
1,781
2,044
14.1
15.0
9.4
10.5
43.9
39.1
9.3
8.8
0.2
0.2
4.4
3.8
Linc Pen & Plastics
Neutral
232
-
344
420
462
9.3
9.3
15.3
17.1
15.2
13.6
2.6
2.7
16.9
19.5
0.9
0.8
M M Forgings
Neutral
628
-
758
542
642
20.1
21.0
41.6
56.8
15.1
11.1
2.1
1.8
0.1
0.2
1.8
1.6
Mirza International
Neutral
167
-
2,003
1,148
1,285
18.0
18.0
8.0
9.4
20.7
17.8
3.4
2.9
16.3
16.1
1.9
1.7
Navkar Corporation
Buy
192
265
2,736
561
617
41.5
41.5
11.5
12.7
16.7
15.1
1.8
1.6
10.5
10.4
5.5
4.8
Nilkamal
Neutral
1,580
-
2,357
2,317
2,525
11.4
11.1
96.0
105.0
16.5
15.0
2.8
2.4
0.2
0.2
1.0
0.9
Stock Watch
September 14, 2017
Company Name
Reco
CMP
Target Mkt Cap
Sales ( Čcr )
OPM(%)
EPS (Č)
PER(x)
P/BV(x)
RoE(%)
EV/Sales(x)
(Č)
Price ( Č)
( Č cr )
FY18E FY19E FY18E FY19E FY18E FY19E FY18E FY19E FY18E FY19E FY18E FY19E FY18E FY19E
zOthers
Parag Milk Foods
Neutral
248
-
2,085
1,987
2,379
7.6
9.0
12.4
18.3
20.0
13.6
2.8
2.5
8.2
13.2
1.2
1.0
Radico Khaitan
Neutral
175
-
2,326
1,811
1,992
13.2
13.2
8.1
8.8
21.6
19.8
2.2
2.4
10.1
12.0
1.6
1.5
Relaxo Footwears
Neutral
511
-
6,141
1,981
2,310
13.7
14.5
12.0
15.5
42.6
33.0
8.3
6.7
0.2
0.2
3.2
2.7
Siyaram Silk Mills
Accumulate
2,275
2,500
2,133
1,769
1,981
12.7
12.7
113.1
131.1
20.1
17.4
3.1
2.7
15.5
15.5
1.4
1.2
Styrolution ABS India* Neutral
946
-
1,664
1,800
1,980
8.0
8.1
42.0
46.2
22.5
20.5
2.5
2.3
0.1
0.1
1.0
1.0
Surya Roshni
Neutral
303
-
1,329
4,870
5,320
7.7
7.8
22.8
28.1
13.3
10.8
1.8
1.5
0.1
0.1
0.5
0.4
TVS Srichakra
Neutral
3,194
-
2,445
2,729
2,893
12.7
12.5
248.5
265.0
12.9
12.1
3.6
3.0
0.3
0.3
0.9
0.8
Visaka Industries
Neutral
652
-
1,036
1,104
1,214
12.1
12.6
31.0
37.9
21.0
17.2
2.6
2.3
0.1
0.1
1.2
1.0
VIP Industries
Accumulate
230
250
3,256
1,450
1,693
10.4
10.5
6.5
7.8
35.2
29.5
7.4
6.5
21.1
22.1
2.2
1.9
Navin Fluorine
Accumulate
652
730
3,212
945
1,154
22.4
22.6
28.7
34.8
22.7
18.8
3.8
3.2
-
-
2.9
2.3
Source: Company, Angel Research; Note: *December year end; #September year end; &October year end; Price as on September 13, 2017
Market Outlook
September 14, 2017
Research Team Tel: 022 - 39357800
DISCLAIMER
Angel Broking Private Limited (hereinafter referred to as “Angel”) is a registered Member of National Stock Exchange of India
Limited,Bombay Stock Exchange Limited and Metropolitan Stock Exchange Limited. It is also registered as a Depository Participant with
CDSL and Portfolio Manager with SEBI. It also has registration with AMFI as a Mutual Fund Distributor. Angel Broking Private Limited is a
registered entity with SEBI for Research Analyst in terms of SEBI (Research Analyst) Regulations, 2014 vide registration number
INH000000164. Angel or its associates has not been debarred/ suspended by SEBI or any other regulatory authority for accessing
/dealing in securities Market. Angel or its associates/analyst has not received any compensation / managed or
co-managed public offering of securities of the company covered by Analyst during the past twelve months.
This document is solely for the personal information of the recipient, and must not be singularly used as the basis of any investment
decision. Nothing in this document should be construed as investment or financial advice. Each recipient of this document should make
such investigations as they deem necessary to arrive at an independent evaluation of an investment in the securities of the companies
referred to in this document (including the merits and risks involved), and should consult their own advisors to determine the merits and
risks of such an investment.
Reports based on technical and derivative analysis center on studying charts of a stock's price movement, outstanding positions and
trading volume, as opposed to focusing on a company's fundamentals and, as such, may not match with a report on a company's
fundamentals. Investors are advised to refer the Fundamental and Technical Research Reports available on our website to evaluate the
contrary view, if any.
The information in this document has been printed on the basis of publicly available information, internal data and other reliable
sources believed to be true, but we do not represent that it is accurate or complete and it should not be relied on as such, as this
document is for general guidance only. Angel Broking Pvt. Limited or any of its affiliates/ group companies shall not be in any way
responsible for any loss or damage that may arise to any person from any inadvertent error in the information contained in this report.
Angel Broking Pvt. Limited has not independently verified all the information contained within this document. Accordingly, we cannot
testify, nor make any representation or warranty, express or implied, to the accuracy, contents or data contained within this document.
While Angel Broking Pvt. Limited endeavors to update on a reasonable basis the information discussed in this material, there may be
regulatory, compliance, or other reasons that prevent us from doing so.
This document is being supplied to you solely for your information, and its contents, information or data may not be reproduced,
redistributed or passed on, directly or indirectly.
Neither Angel Broking Pvt. Limited, nor its directors, employees or affiliates shall be liable for any loss or damage that may arise from
or in connection with the use of this information.